Causation
At the beginning of this course, we considered four different claims associated with the following news article1.
- The Consumer Price Index rose 8.3% in April.
- The global consumer price index rose in April.
- The Consumer Price Index rose 8.3% because of the war in Ukraine.
- The Consumer Price Index will likely rise throughout the summer.

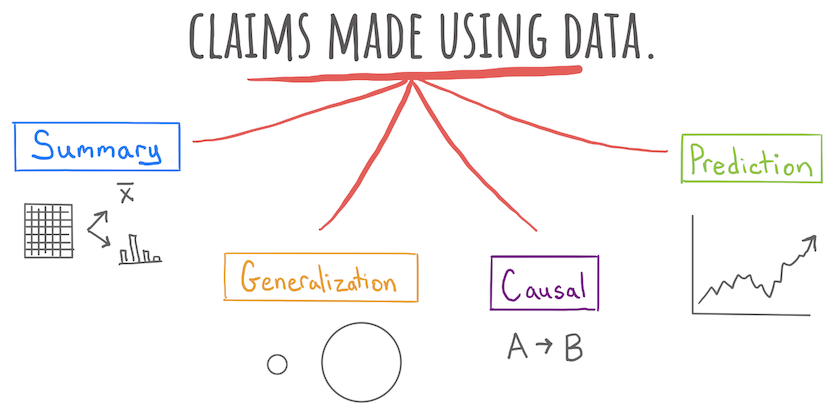
Each one of these four claims illustrates a different type of claim made using data. As a brief recap of where we are in this course, let’s take them each in turn.
- The Consumer Price Index rose 8.3% in April.
This is a claim concerning the nature of the data that is on hand, a descriptive claim. While these seem like the most straightforward type of claim, don’t underestimate their utility or the challenges involved in crafting them. Deciding which measure is most appropriate is tricky work and the process of wrangling the data takes careful thought and time.
- The global consumer price index rose in April.
This claim looks deceptively like the first but there is one important difference. The first claim concerns the CPI, which is calculated using data from the US. This second claim is about the broader global population of which the US data is a subset. In other words, this is a generalization from a sample to a population.
For a generalization to be sound, we must take several considerations into account. First off: is the sample representative of the population or is it biased in some way? Secondly: what sources of variability are present? When working with a sample that originated from a chance method, it’s important to consider the degree to which sampling variability might be able to explain the structure you see in the data. Our primary tools in this area are the confidence interval, to assess the uncertainty in a statistic, and the hypothesis test, to assess whether a particular statistic is consistent with an assertion about the state of the population parameters.
- The Consumer Price Index will likely rise throughout the summer.
This is a prediction, a claim that uses the structure of the data at hand to predict the value of observations about which we have only partial information. In midsummer, we know the date will be July 15th, that’s the x-coordinate. But what will the y-coordinate be, the Consumer Price Index? Now we recognize this as a regression problem.
- The Consumer Price Index rose 8.3% because of the war in Ukraine.
This bring us to the final claim, which is one concerning causation. The claim asserts that the structure in the data (the rise in the CPI) can be attributed to specific cause (the war in Ukraine). Causal claims are often the most challenging claims to craft but they are also some of the most useful. Uncovering causes and effects is at the heart of many sciences from Economics to Biomedicine. They also help guide decision making for individuals (is it worth my time to study for the final?) as well as for organizations (will Twitter’s new option to pay for verification result in a net increase in revenue for the company?).
For the remainder of Stat 20, we lay the foundation for causation, first by defining it precisely, then identifying a few of the most powerful strategies for inferring it from data.

Footnotes
Smialek, Jeanna (2022, May 11). Consumer Prices are Still Climbing Rapidly. The New York Times. https://www.nytimes.com/2022/05/11/business/economy/april-2022-cpi.html↩︎