Generalization
- An introduction to the next unit of Generalization
In an enormously entertaining paper written about a decade ago, the economist Peter Backus estimated his chance of finding a girlfriend on any given night in London at about 1 in 285,000 or 0.0000034%. As he writes, this is either depressing or cheering news for a person, depending on what you had estimated your chance to be before reading the paper and doing a similar computation for yourself.1 The interesting point in the paper was using a probabilistic argument (originally developed by the astronomer and astrophysicist Frank Drake to estimate the probability of extra-terrestrial civilizations) to think about his dating problems. Anyone can follow the arguments put forward by Backus, including his statements that use probability, which is the topic of the next few lectures.
So far, we have examined data sets and summarized them, both numerically and visually. We have looked at data distributions, and associations between variables. The big question is: Can we extend the conclusions that we make about the data sets to larger populations? If we notice that bill length and flipper length have a strong linear relationship for the penguins in our data, can we say this is true about all penguins? How do we draw valid conclusions about the population our data was drawn from?
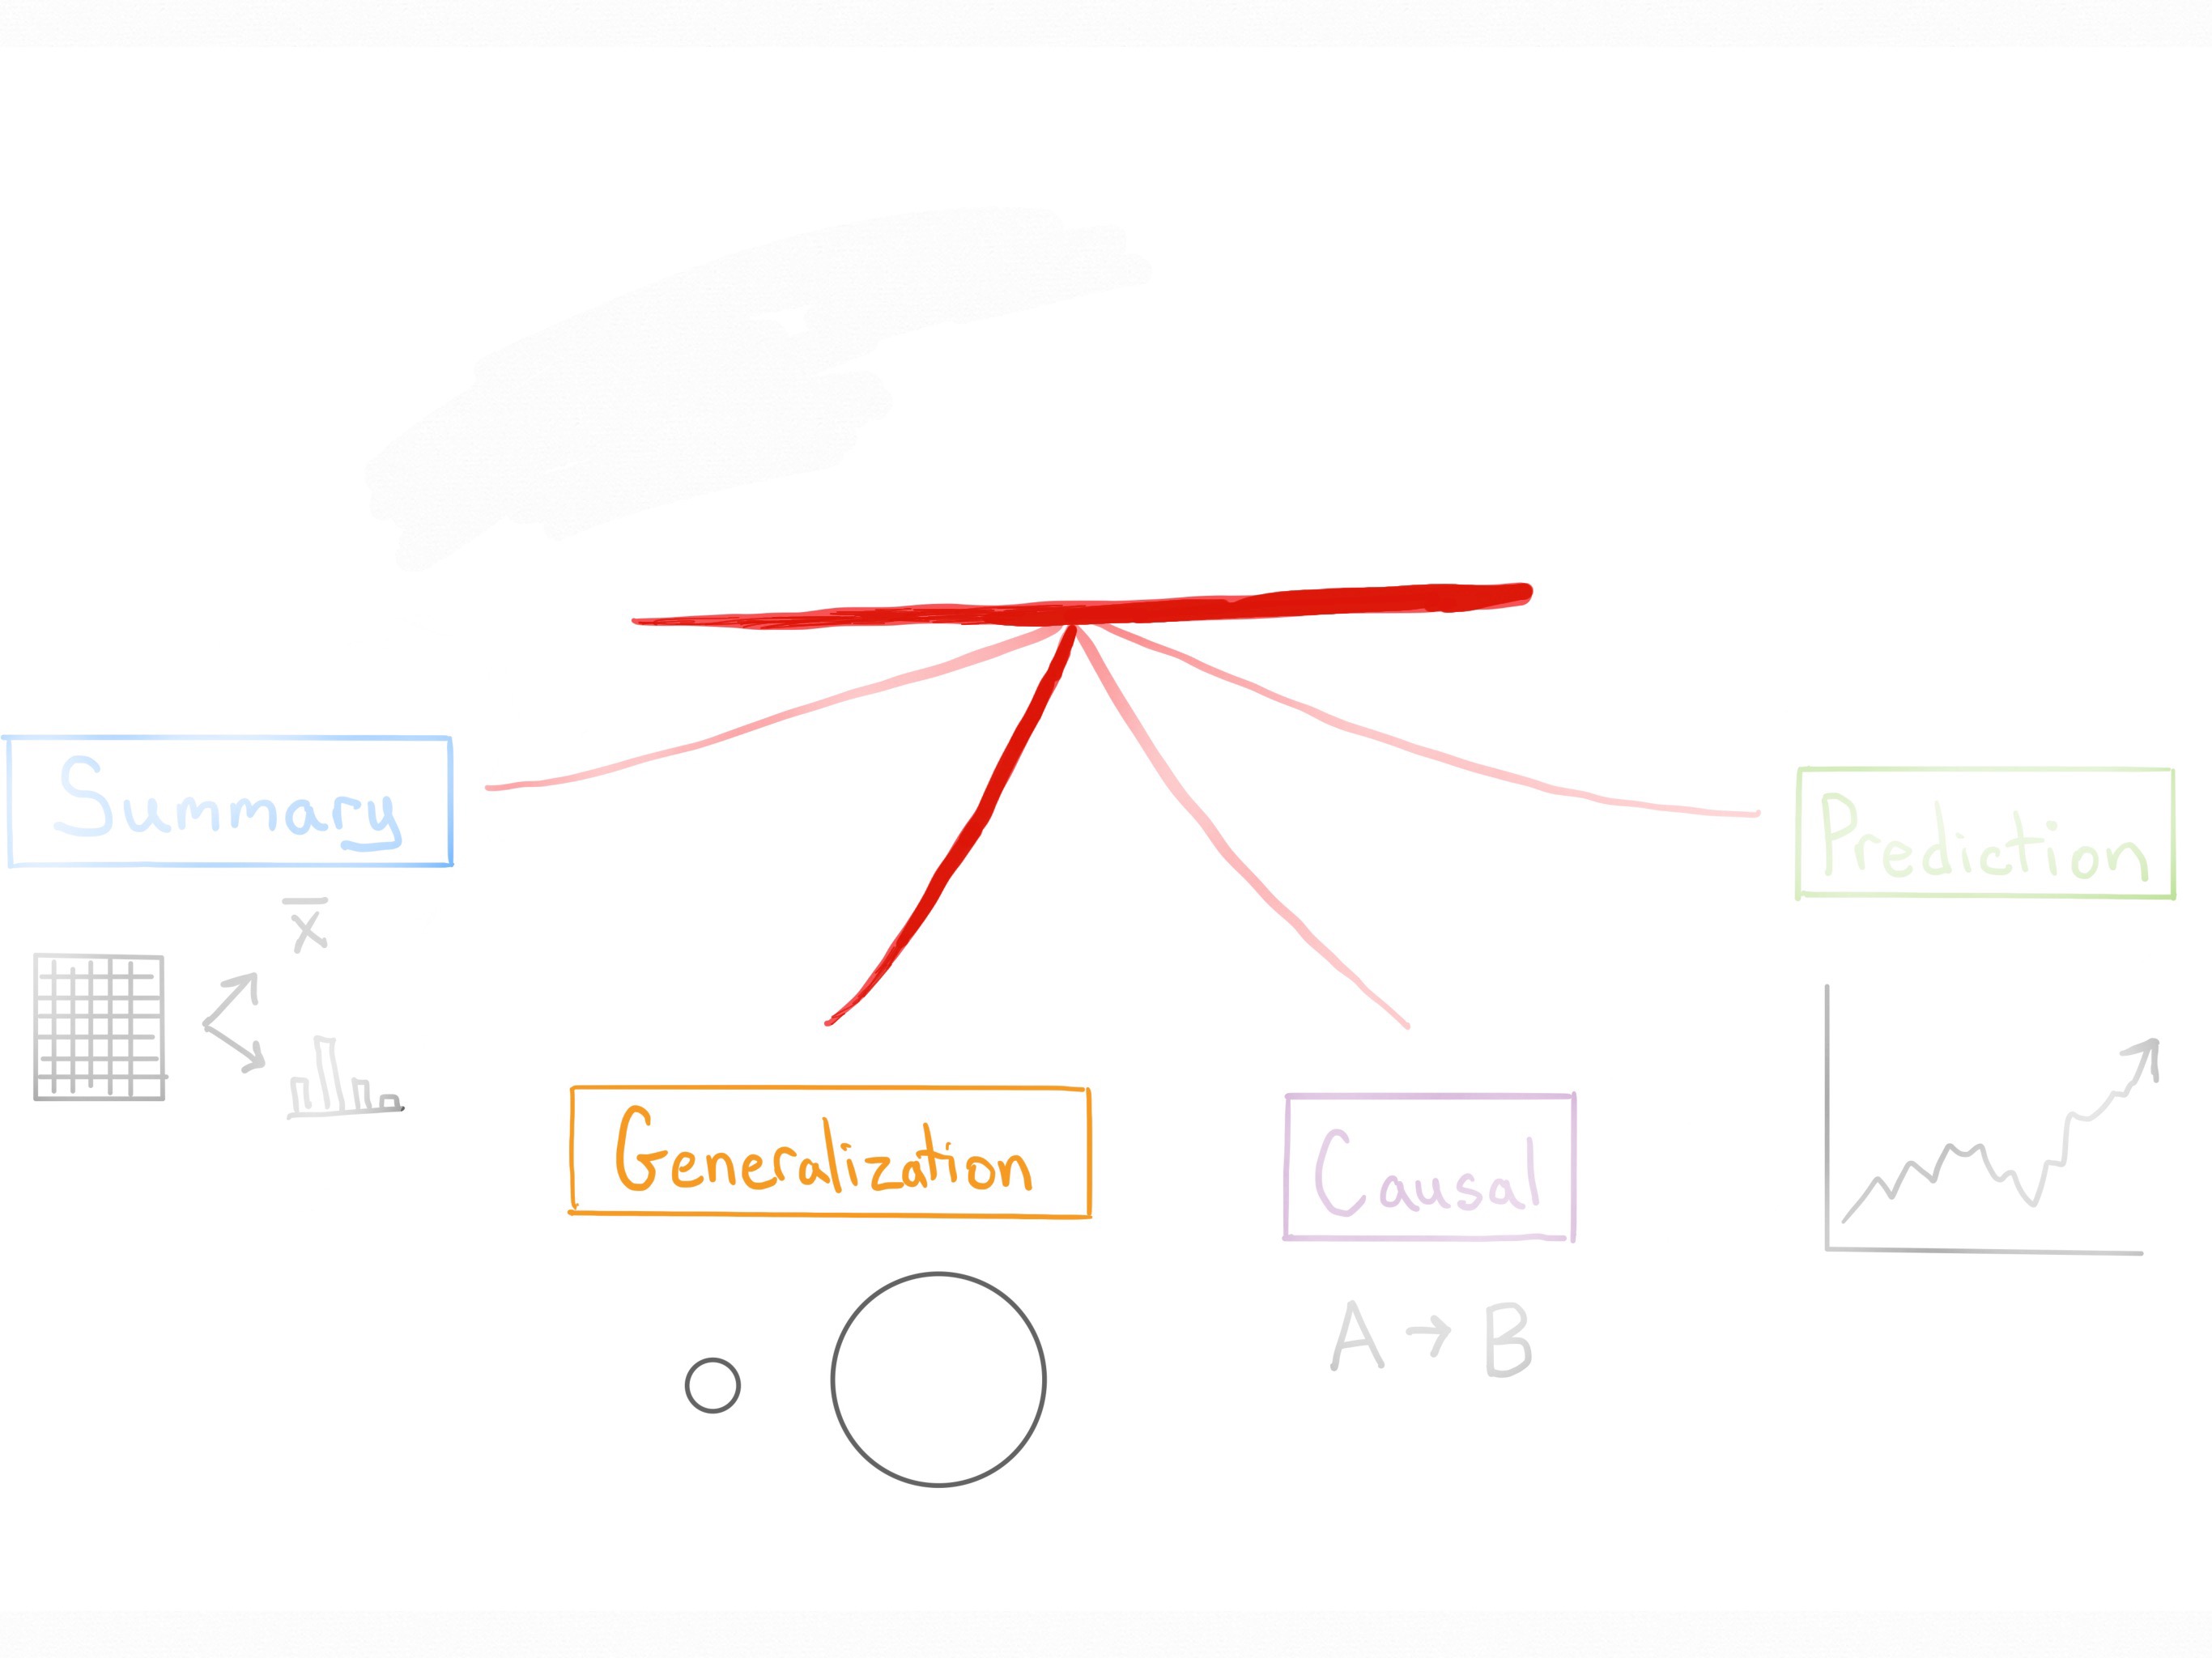
Making such conclusions is called generalization, and this is the second of the four types of claims we discussed at the beginning of the semester. We got our data, explored the data by creating graphical and numerical summaries, thought about the questions we wanted to ask, and now we want to generalize from the data to the world.
What are the kinds of questions we might ask? For example, perhaps we want to poll voters to estimate the support for decriminalizing marijuana possession federally. You can imagine that which voters are selected for such an opinion poll can make a big difference in the estimate of the proportion of voters who support decriminalization of marijuana. Or you might want to know the chance that you will get an A in Stat 20? (About 36%, based on last spring)2. Maybe you don’t care about grades that much - there are bigger things to worry about, like the chance that the Democrats will win the House this fall in the Midterm elections? (About 80%, according to political scientists at Cornell whose model has been correct in the last 14 congressional elections.)3. Maybe you have a board game night and want to know the chance you will roll a double on your next turn to get out of jail while playing Monopoly? (One in six. Can you figure out why?)
To answer these questions, we need an understanding of the language and notation of chance or probability.
Footnotes
Paper is at https://www.astro.sunysb.edu/fwalter/AST248/why_i_dont_have_a_girlfriend.pdf and a talk by Backus at https://www.youtube.com/watch?v=ClPPSry8bBw ↩︎
https://berkeleytime.com/grades/?input=STAT%3B122042%3BT%3B2026%3ASpring%3A1 ↩︎
https://news.cornell.edu/stories/2026/09/midterm-forecast-strongly-favors-democrats-win-house-majority↩︎