Summarization
In spring of 2022, the New York Times ran the following story1.
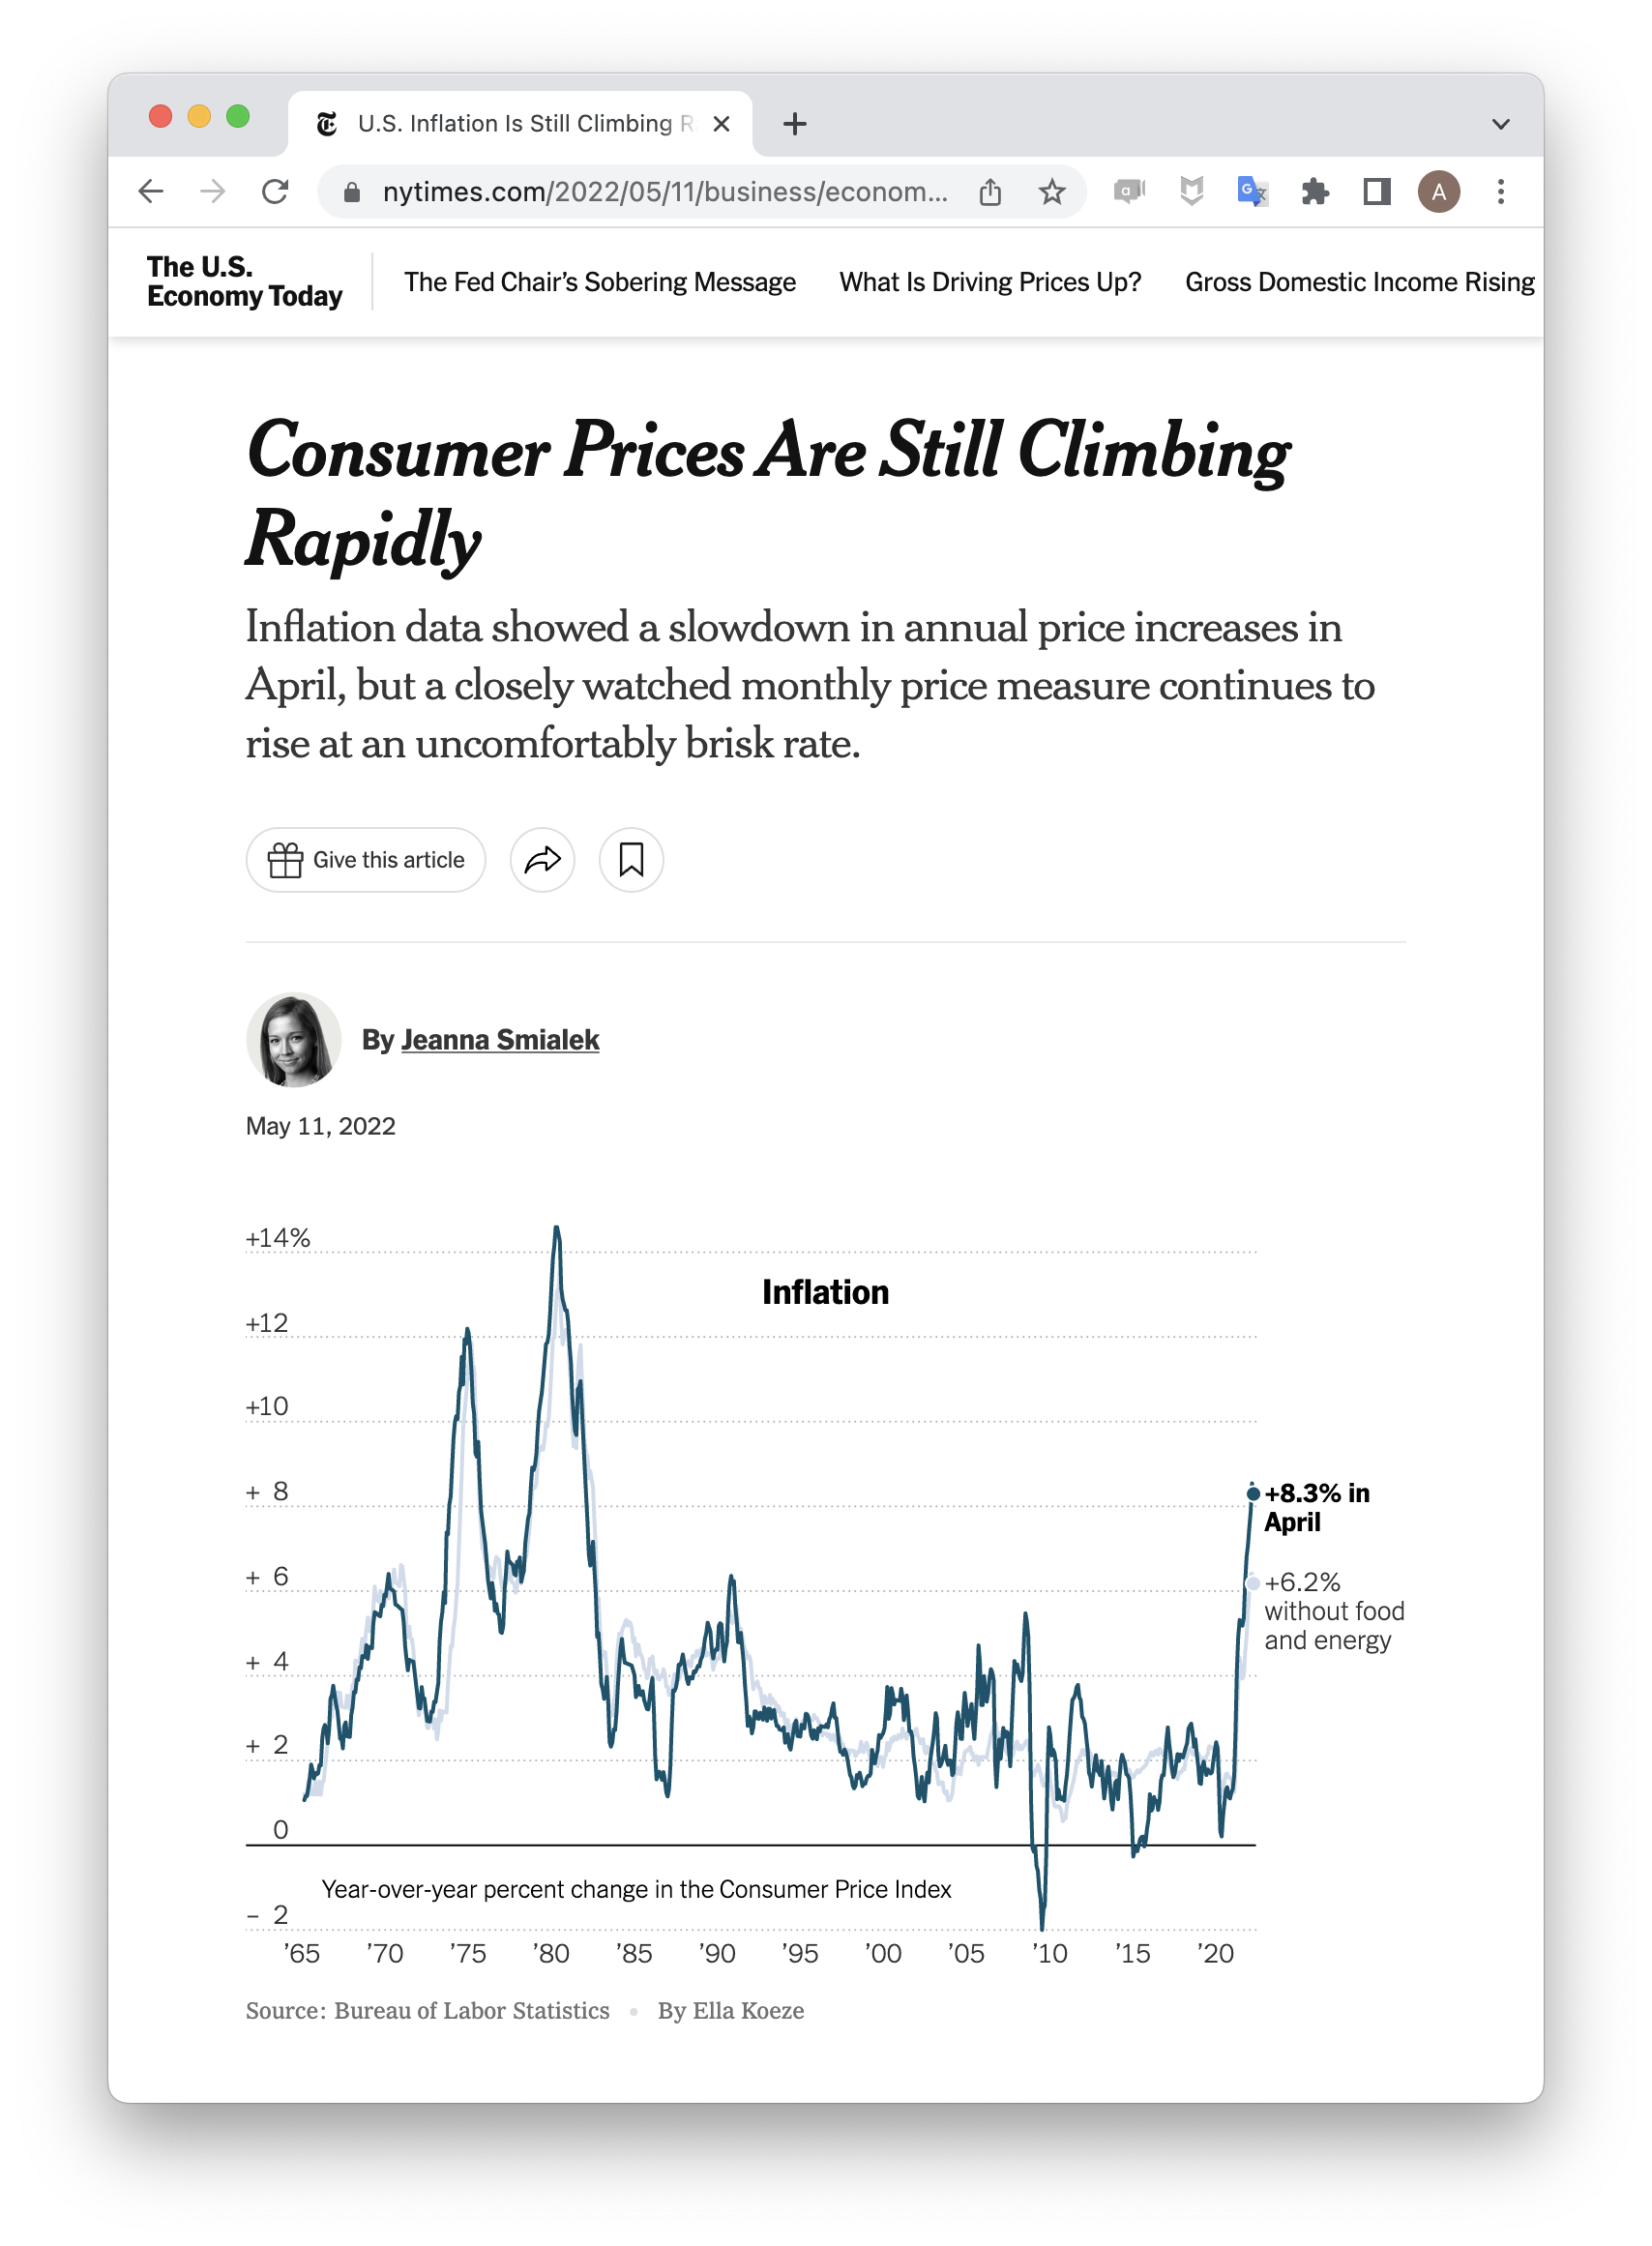
“Consumer Prices” refers to the Consumer Price Index2, a weighted average of the prices of thousands of everyday consumer goods: sports equipment, soft drinks, sneakers, internet service, etc. An increase in that index is thought to correspond to rising inflation.
Look carefully at the line plot. Which of the following four claims does it support?
- The CPI rose 8.3% in April, 2022.
- The CPI will likely rise throughout the summer of 2022.
- The global consumer price index rose in April, 2022.
- The CPI rose 8.3% because of the war in Ukraine.
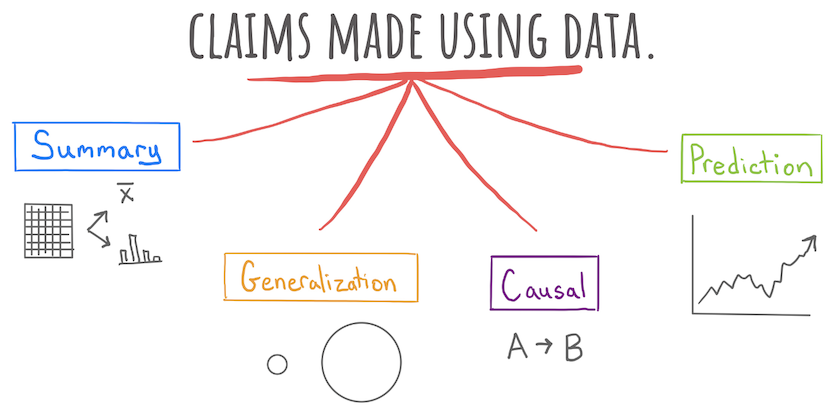
In truth, this plot could be consistent with all these claims. They are, in turn, a summary, a prediction, a generalization, and a causal claim. This newspaper headline falls squarely in the first category, a summary, which seeks only to describe the data set that is on hand.
Although 8.3% seems like a simple enough number, it is actually summarizing a vast data set of thousands of prices. The process of describing a data set invariably involves summarizing it, either with numerical summaries like 8.3% or with graphical summaries like the line plot show above.
In this unit, we will learn to critique and construct descriptive claims made with data. Although they sound elementary, descriptive claims are the most common form of claim made using data. They have the power to move, if not mountains, at least markets.
Footnotes
Smialek, Jeanna (2022, May 11). Consumer Prices are Still Climbing Rapidly. The New York Times. https://www.nytimes.com/2022/05/11/business/economy/april-2022-cpi.html↩︎
To learn more, check out the Wikipedia page on the CPI in the US and the exhaustive description of how the data is collected at the US Bureau of Labor Statistics↩︎