Lab: A Matter of Taste

STAT 20: Introduction to Probability and Statistics

Making Claims with Data

  • So far: Pose question -> observe data -> analyze data -> make claim.
  • e.g. Checking election results:
    1. Did fraud occur?
    2. Observe vote counts by city.
    3. Test of hypothesis that votes follow Benford’s law.
    4. Votes don’t follow Benford’s law well; but we wouldn’t expect them to in a fair election.

Making Claims with Data

  • This week:
    1. Identify possible claim
    2. Imagine analysis that would show it.
    3. Plan data collection to allow that analysis.
    4. Carry out data collection + analysis.
    5. Check claim.

But first

Please get into groups of 3 (or 4). Take turns introducing yourselves.

A Matter of Taste

Your challenge: Determine whether you can affect one your teammates’ perceptions of bubble water by manipulating their experience of tasting.

Each team will have access to

  • 50 minutes (half of next class)
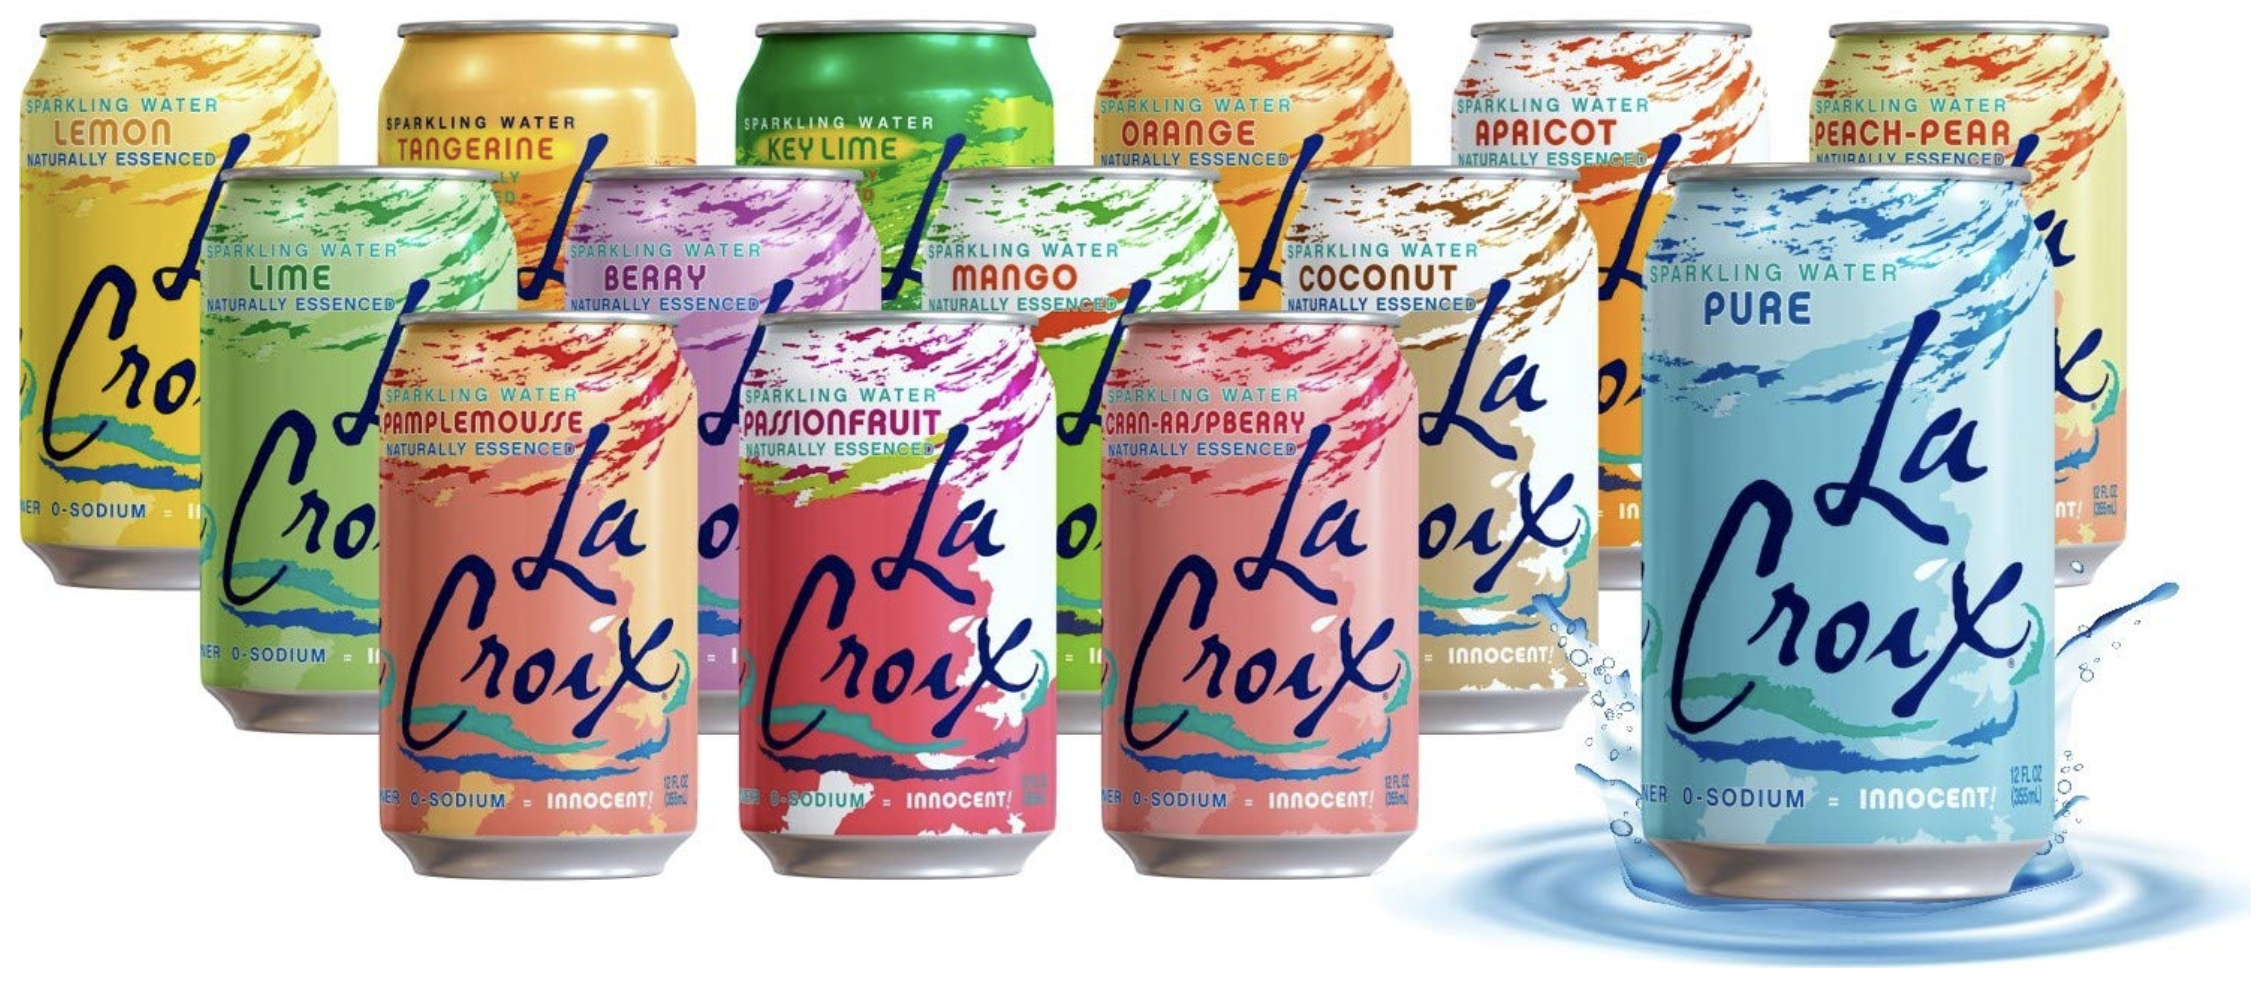
  • 2 cans of soda water, each one from a different flavor
  • small paper cups
  • saltine crackers
  • other materials welcome
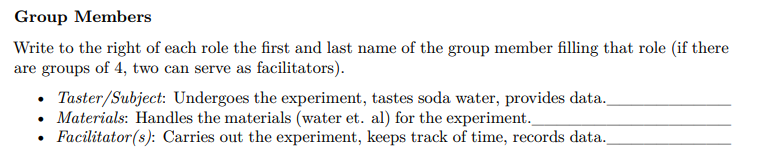
Group Members

Write to the right of each role the first and last name of the group member filling that role (if there are groups of 4, two can serve as facilitators).

  • Taster/Subject: Undergoes the experiment, tastes soda water, provides data.__________
  • Materials: Handles the materials (water et. al) for the experiment.________________
  • Facilitator(s): Carries out the experiment, keeps track of time, records data.__________

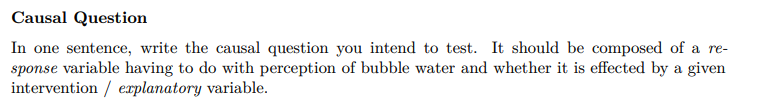
Question and Hypotheses
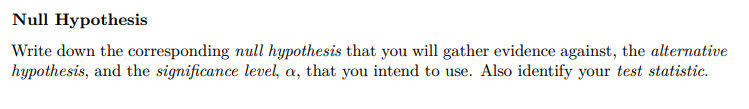
In one sentence, write the causal question you intend to test. It should be composed of a response variable having to do with perception of bubble water and whether it is affected by a given intervention / explanatory variable. Also identify your unit of observation.

Hypotheses

Write down the corresponding null hypothesis that you will gather evidence against, the alternative hypothesis, and the significance level, \(\alpha\), that you intend to use. Also identify your test statistic.

Protocol

Record below the step-by-step protocol that you will use to collect data to bear on the claim above. Be precise. You should be able to hand this off to another group and have them conduct your experiment.

Data

In the space below, sketch out an empty data frame that identifies the important characteristics of your data. Create the data frame such that the number of rows reflect your sample size, \(n\), and the number of columns represent the variables that you intend to collect. Label the columns with the names of those variables and note how you are defining your unit of observation.

Graphics

Sketch a plot that you will use to use to determine how consistent your data are with your original claim. Please label the axes. Since you do not yet have data, create two sketches of what the plot might look like in two scenarios. Below each plot, write the ggplot2 code that will create that graphic. Note: these are plots of data, not null distributions of statistics.

Scenario 1: Data supports \(H_0\)             Scenario 2: Data supports \(H_A\)

Things to remember

  • Be precise in your protocol.
  • Be sure your claim corresponds to your protocol corresponds to your data corresponds to your plots.
  • Important: Part I must be fully completed and shown to instructor/tutor before beginning part II.
50:00

Part II

The Essential Question of Our Time

Which is the best flavor?

Please:

  1. Conduct your experiment
  2. Record your data
  3. Complete and submit part II as a group

If you don’t finish in the allotted time, finish up after class.

60:00

Could your taster distinguish between flavors?

  1. Yes, and it was statistically significant (p < .05).
  2. Yes, but it was not statistically significant (p > .05).
  3. Yes, but we haven’t conducted the test yet.
  4. No.
  5. Not sure, we haven’t computed the difference in proportions yet.
  6. We tested a different claim.