Create a 95% confidence interval using the normal curve for the overall proportion of students who support the People’s Park Project without having been exposed to the information on page 14. Interpret the interval in the context of the problem in a clear sentence. Does your point estimate approximately match that reported in the Chancellor’s email?
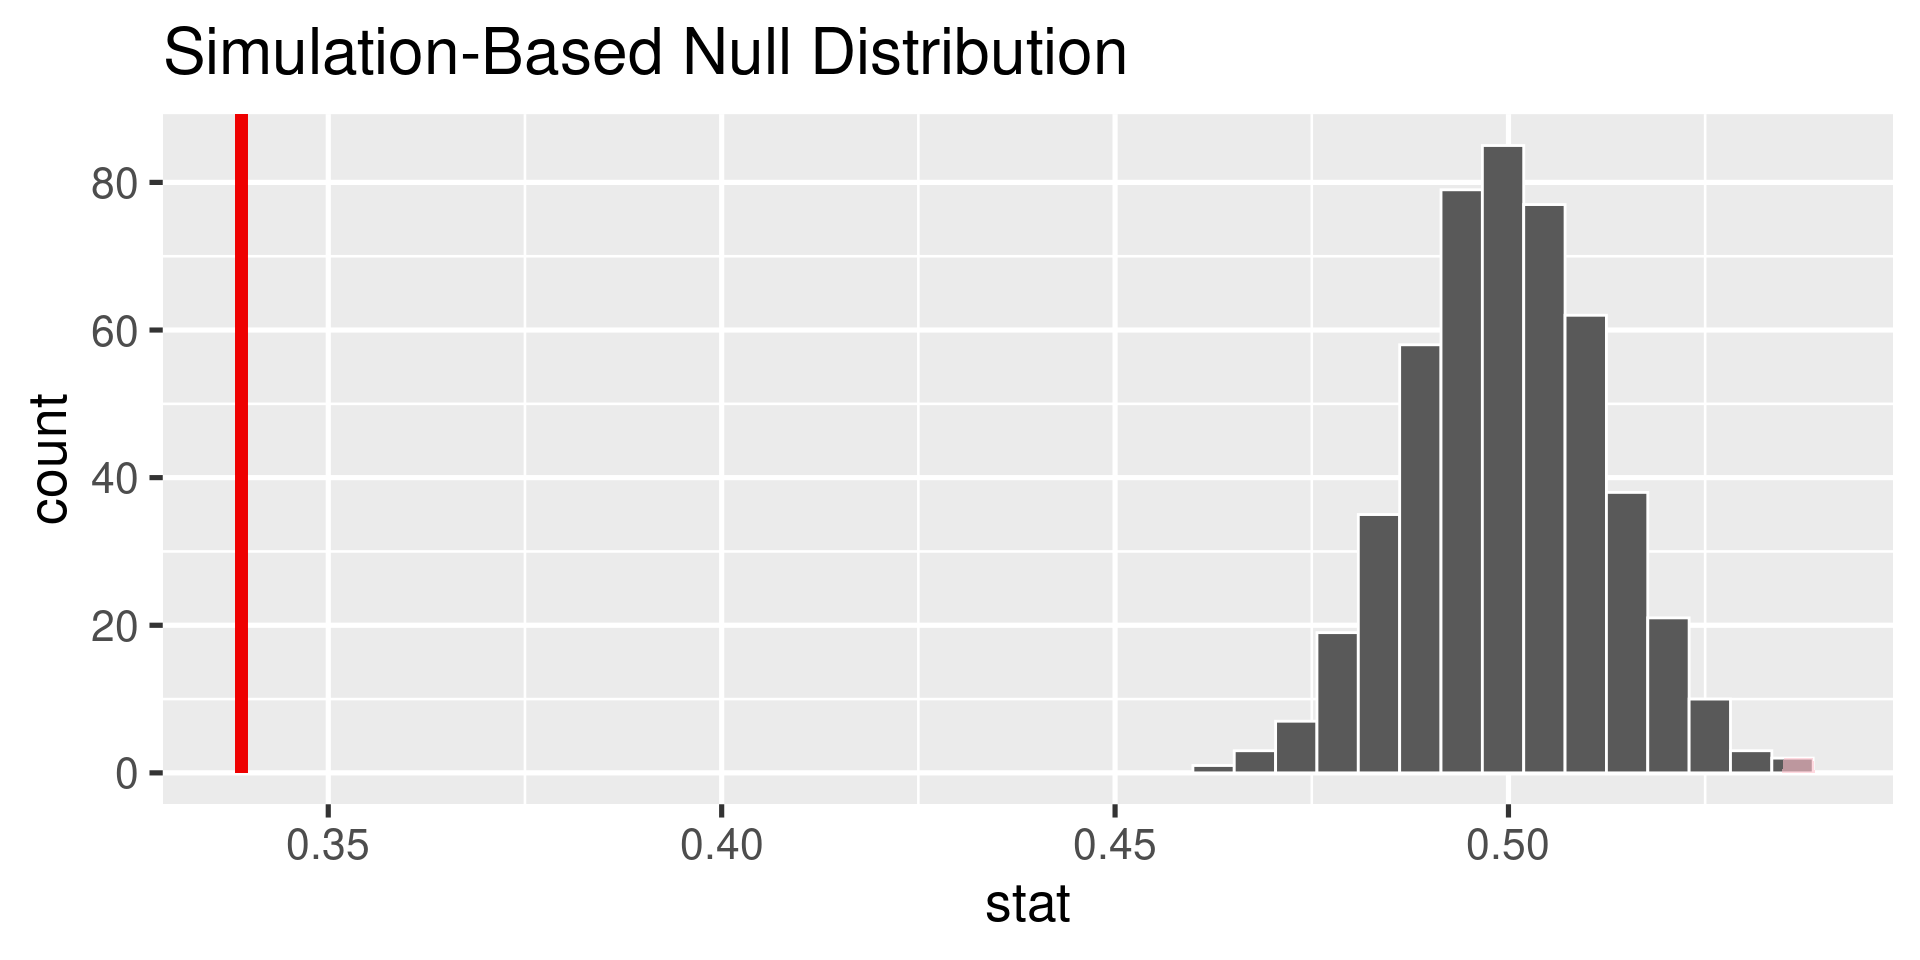
Instead of constructing a confidence interval to learn about the parameter, we could assert the value of a parameter and see whether it is consistent with the data using a hypothesis test. Say you are interested in testing whether there is a clear majority opinion of support or opposition to the project.
What are the null and alternative hypotheses?
01:00
library(tidyverse)
library(infer)
library(stat20data)
ppk <- ppk |>
mutate(support_before = Q18_words %in% c("Somewhat support",
"Strongly support",
"Very strongly support"))
obs_stat <- ppk |>
specify(response = support_before,
success = "TRUE") |>
calculate(stat = "prop")
obs_statResponse: support_before (factor)
# A tibble: 1 × 1
stat
<dbl>
1 0.339
null <- ppk |>
specify(response = support_before,
success = "TRUE") |>
hypothesize(null = "point", p = .5) |>
generate(reps = 500, type = "draw") |>
calculate(stat = "prop")
nullResponse: support_before (factor)
Null Hypothesis: point
# A tibble: 500 × 2
replicate stat
<fct> <dbl>
1 1 0.507
2 2 0.510
3 3 0.483
4 4 0.482
5 5 0.491
6 6 0.507
7 7 0.505
8 8 0.492
9 9 0.508
10 10 0.502
# ℹ 490 more rows
What would a Type I error be in this context?
01:00
What would a Type II error be in this context?
