# A tibble: 1 × 3
   xbar    sx     n
  <dbl> <dbl> <int>
1 118. 81.5 30Confidence Intervals
STAT 20: Introduction to Probability and Statistics
Concept Questions
You embark on a mission to estimate a population mean using a simple random sample of \(n\) observations.
What sample size would you need to increase the precision of your estimate by approximately 3x compared to the original sample?
01:00
What is an approximate 95% confidence interval for the mean air time in flights using the normal curve?
01:00
An economist aims to estimate the average weekly cost of groceries per household in two cites: Oakland, CA (population ~400,000) and Fremont, CA (population ~200,000). Both of these populations of households are presumed to have a similar standard deviation of weekly grocery costs. The economist takes a simple random sample (without replacement) of 100 households from each city, records their costs, and computes a 95% confidence interval for the average weekly cost.
Approximately how much wider would Oakland’s confidence interval be than Fremont’s?
01:00
An economist aims to estimate the average weekly cost of groceries per household in two cites: Grimes, CA (population ~400) and Tranquility, CA (population ~800). Both of these populations of households are presumed to have a similar standard deviation of weekly grocery costs. The demographer takes a simple random sample (without replacement) of 100 households from each city, records their costs, and computes a 95% confidence interval for the average weekly cost.
Approximately how much wider would Tranquility’s confidence interval be than Grimes’s?
01:00
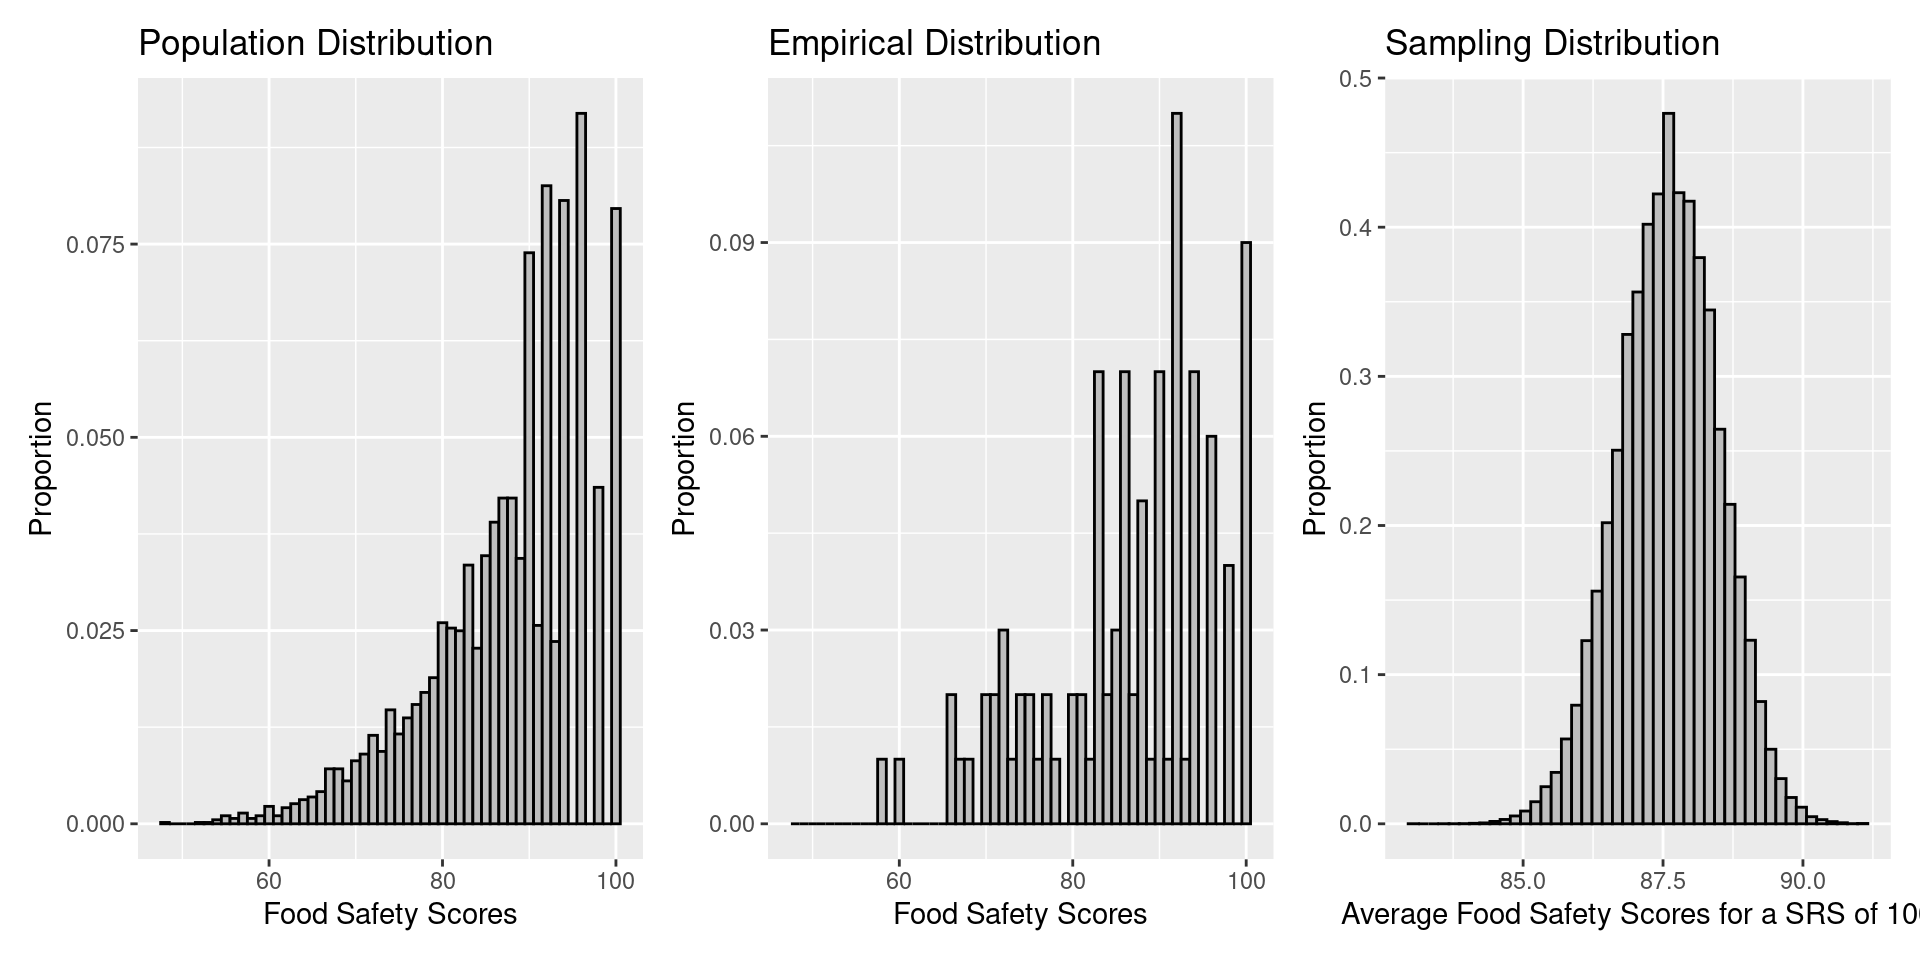
What will happen to the shape of the empirical distribution as we increase \(n\)?
01:00

What will happen to the shape of the sampling distribution as we increase \(n\)?
01:00