10:00
For the following set of questions, you’ll be presented with a scenario and then asked to identify whether the scenario describes a
Binomial distribution (if so, what are \(n\) and \(p\)?)
Hypergeometric distribution (if so , what are \(N\), \(G\), and \(n\)?)
Neither of these (why)?
Roll a fair ten-sided die 20 times. We count the number of times we roll a multiple of 3.
Binomial with \(n = 20\) and \(p = \dfrac{3}{10}\)
YouGov surveyed 1,500 adult US citizens in December 2023, and counted the number of respondents who had read at least one book that year. The population of the US is about 335 million.
Hypergeometric(\(N = 335\) mill, \(n = 1500\), \(G\)).
\(G\) is the number of people in the US who have read at least one book.
A six-sided die is tossed twice, and we check if the sum of the spots is 8 or not.
A bag that has 6 pieces of fruit: 2 mangoes, 3 apples, and 1 orange. I reach into the bag and draw out one fruit at a time, selecting each fruit at random (so all the fruit left in the bag are equally likely on each draw). I put the fruit away after I take it out (and don’t put it back into the bag). I count the number of draws until and including the first time I draw a apple.
Neither.
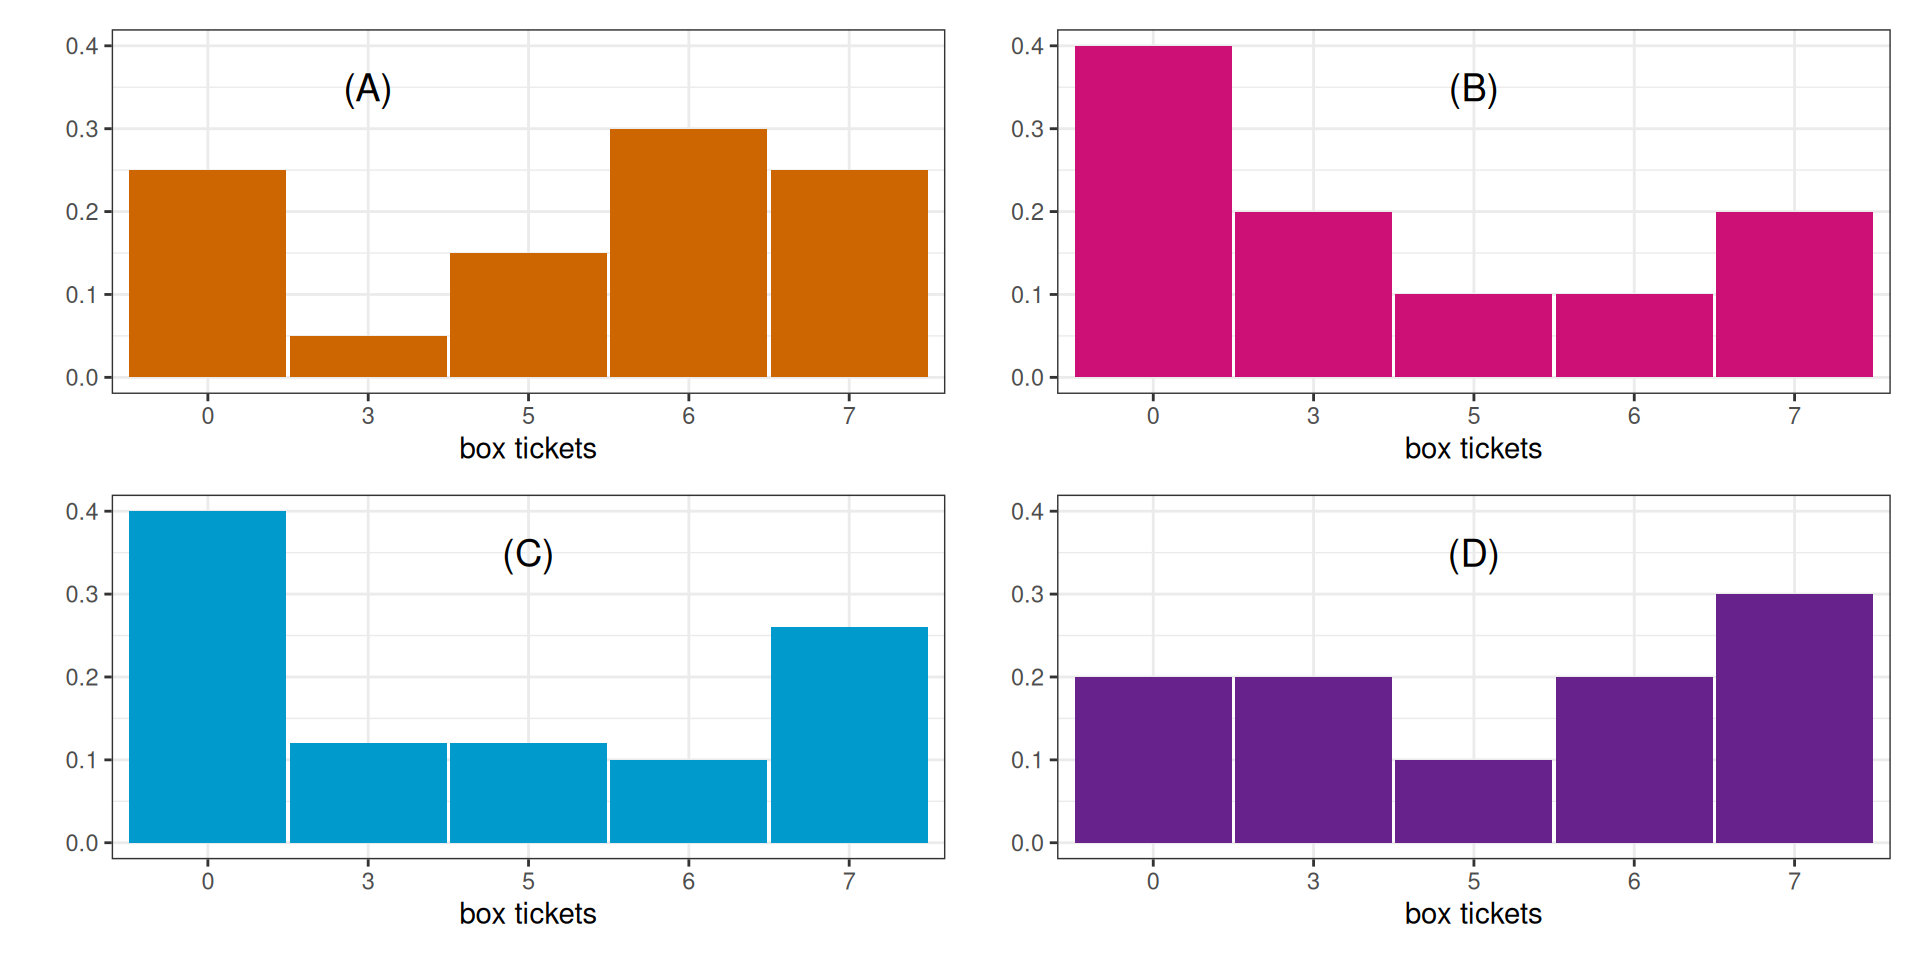
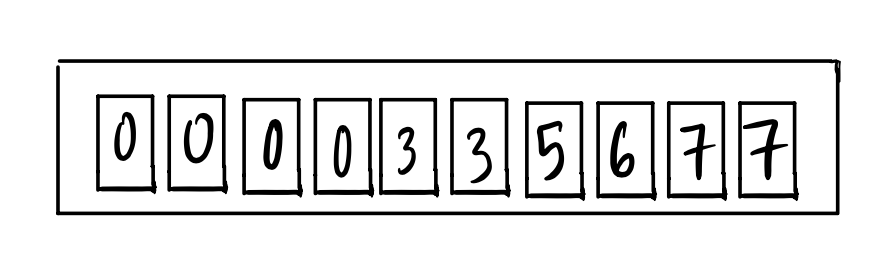
Consider the following box of tickets. Match each of the following (lettered) plot to its accurate description as given on page 2 your warm up sheet:

Match the description number below to the letter of the plot on the slide:
The probability histogram for the value of a ticket drawn at random from the box
An empirical histogram for which the data were generated by drawing 10 tickets from the box with replacement
An empirical histogram for which the data were generated by drawing 100 tickets from the box with replacement
An empirical histogram generated by 20 draws from a different box.

20:00
05:00
25:00
