Conditioning
Agenda
- Announcements
- Comcept Questions: Conditioning
- Break
- Worksheet: Conditioning
- Break
- Lab 2: Flights
- Appendix: More on conditioning
Announcements
- You are allowed one, one-sided, handwritten cheatsheet for the Quiz on Thursday.
- Practice problems on canvas page
- Lab 2 Part 2 now on website, quite long get started early
- Office Hours: TA’s Thursdays 5-7 location TBD
- Curtis: Fridays 9am-11am Evans 493
Concept Questions
Which of the following pieces of code will not cause an error?
- A
penguins
  |> mutate(bill_size = bill_len * bill_dep)
|> select(bill_size)- B
penguins |>
  mutate(bill_size = bill_len * bill_dep) |>
select(bill_size)- C
penguins |>
  mutate(penguins, bill_size = bill_len * bill_dep) |>
select(penguins, bill_size)00:45
Which option describes a filter operation?
A: Subsetting the rows of a data frame according to their position.
B: Subsetting the columns of a data frame based on their names.
C: Subsetting the rows of a data frame based on their values of particular variables.
00:30
What will the following command return?
mean(c(TRUE, TRUE, TRUE, FALSE))
A
TRUEB
FALSEC: An error will be produced
D:
0.75E:
0.25
00:40
Which of the following lines of code correctly extracts rows from the penguins data frame that are of the desired species?
A:
filter(penguins, species %in% c("Adelie", "Chinstrap"))B:
filter(penguins, species == c("Adelie", "Chinstrap"))C:
filter(penguins, species = c("Adelie", "Chinstrap"))D:
slice(penguins, species %in% c("Adelie", "Chinstrap"))E:
select(penguins, species %in% c("Adelie", "Chinstrap"))
00:30
Break
05:00
Worksheet: Conditioning
30:00
Break
05:00
Lab 2: Flights
30:00
Appendix - more practice!
What will this line of code return?
01:00
Evaluating equivalence, cont.
In R, this evaluation happens element-wise when operating on vectors.
[1] TRUE TRUE FALSE[1] FALSE FALSE TRUE[1] TRUE TRUE FALSEQuestion 2
Which observations will be included in the following data frame?
01:00
Question 3
Which data frame will have fewer rows?
Building data pipelines
Consider the subset of students here:
How do we extract the average of these students’ chance that class will be disrupted by a new COVID variant?
Let’s look at three different ways to answer this question
Nesting
Nesting
Nesting
Nesting
Nesting
Cons
- Must be read from inside out
- Hard to keep track of arguments `
Pros
- All in one line of code
- Only refer to one data frame
Step-by-step
Cons
- Have to repeat data frame names
- Creates unnecessary objects
Pros
- Stores intermediate objects
- Can be read top to bottom
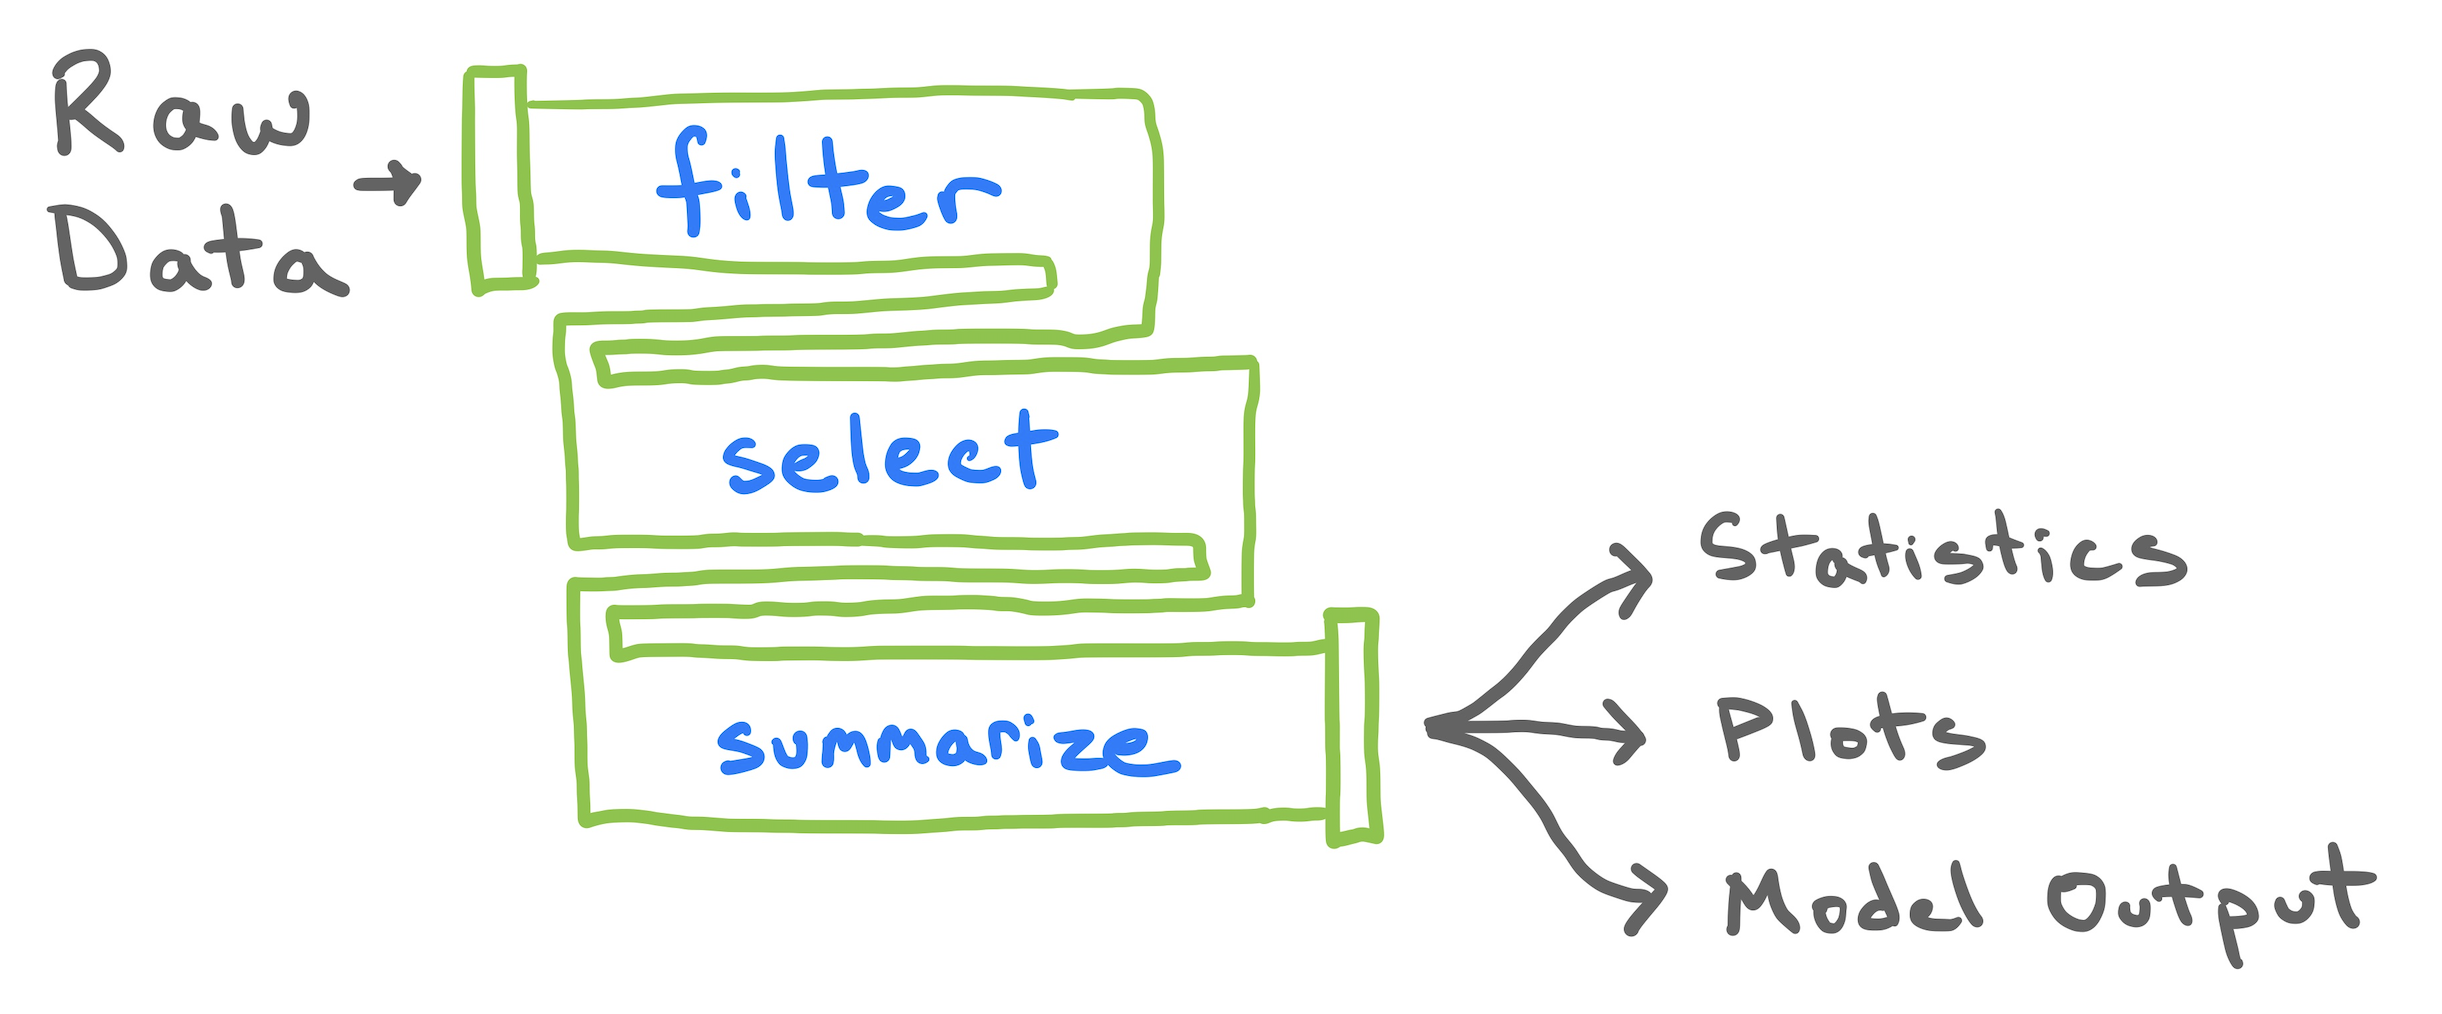
Using the pipe operator
Cons
Pros
- Can be read like an english paragraph
- Only type the data once
- No leftovers objects
Understanding your pipeline
It’s good practice to understand the output of each line of code by breaking the pipe.
Concept Question
What are the dimensions (rows x columns) of the data frames output at each stage of this pipe?
01:00
What is will this line of code return?
01:00
Boolean Algebra
Logical vectors have a dual representation as TRUE FALSE and 1, 0, so you can do math on logicals accordingly.
Taking the mean of a logical vector is equivalent to find the proportion of rows that are
TRUE(i.e. the proportion of rows that meet the condition).
Worksheet: Conditioning
20:00
Break
05:00
Lab Part I: Flights
25:00