Summarizing Categorical Data
The table below displays data from a survey on a class of students.
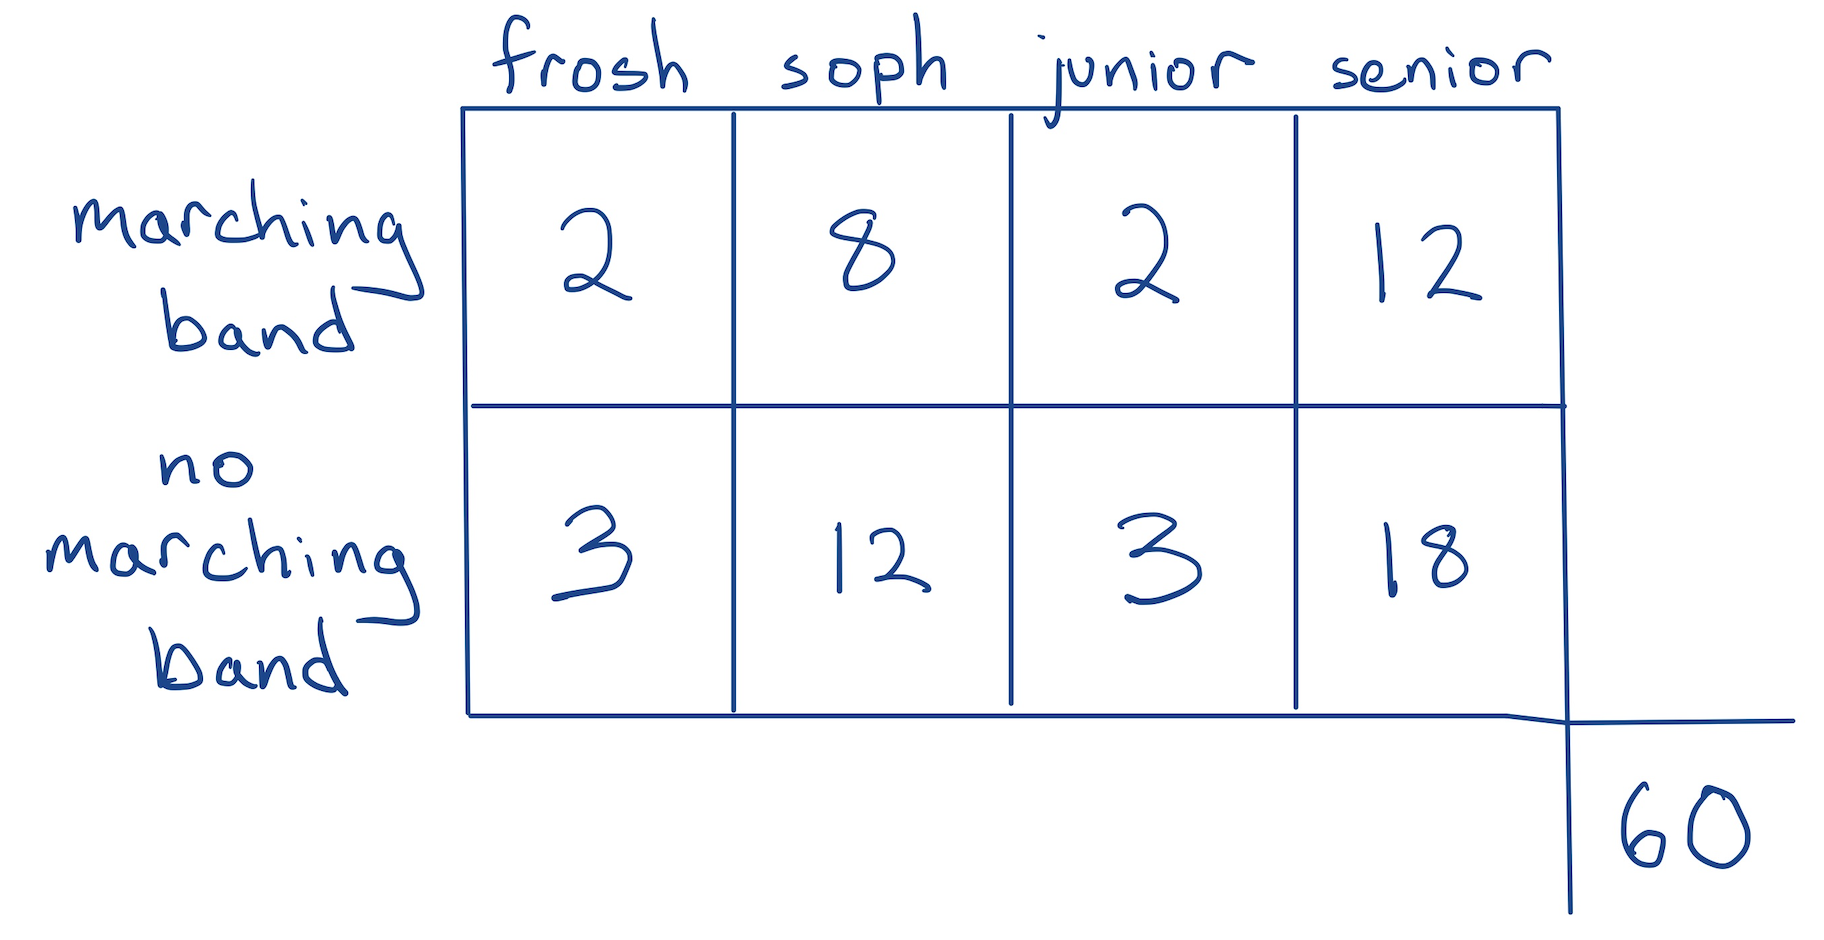
What proportion of the class was in the marching band?
00:30
What proportion of those in the marching band where juniors?
00:30
What proportion were sophomores not in the marching band?
00:30
What were the dimensions of the raw data from which this table was constructed?
00:30
How would you characterize the association between these two variables?
00:30
CQ 2
Political affiliation and college degree status of 500 survey participants.
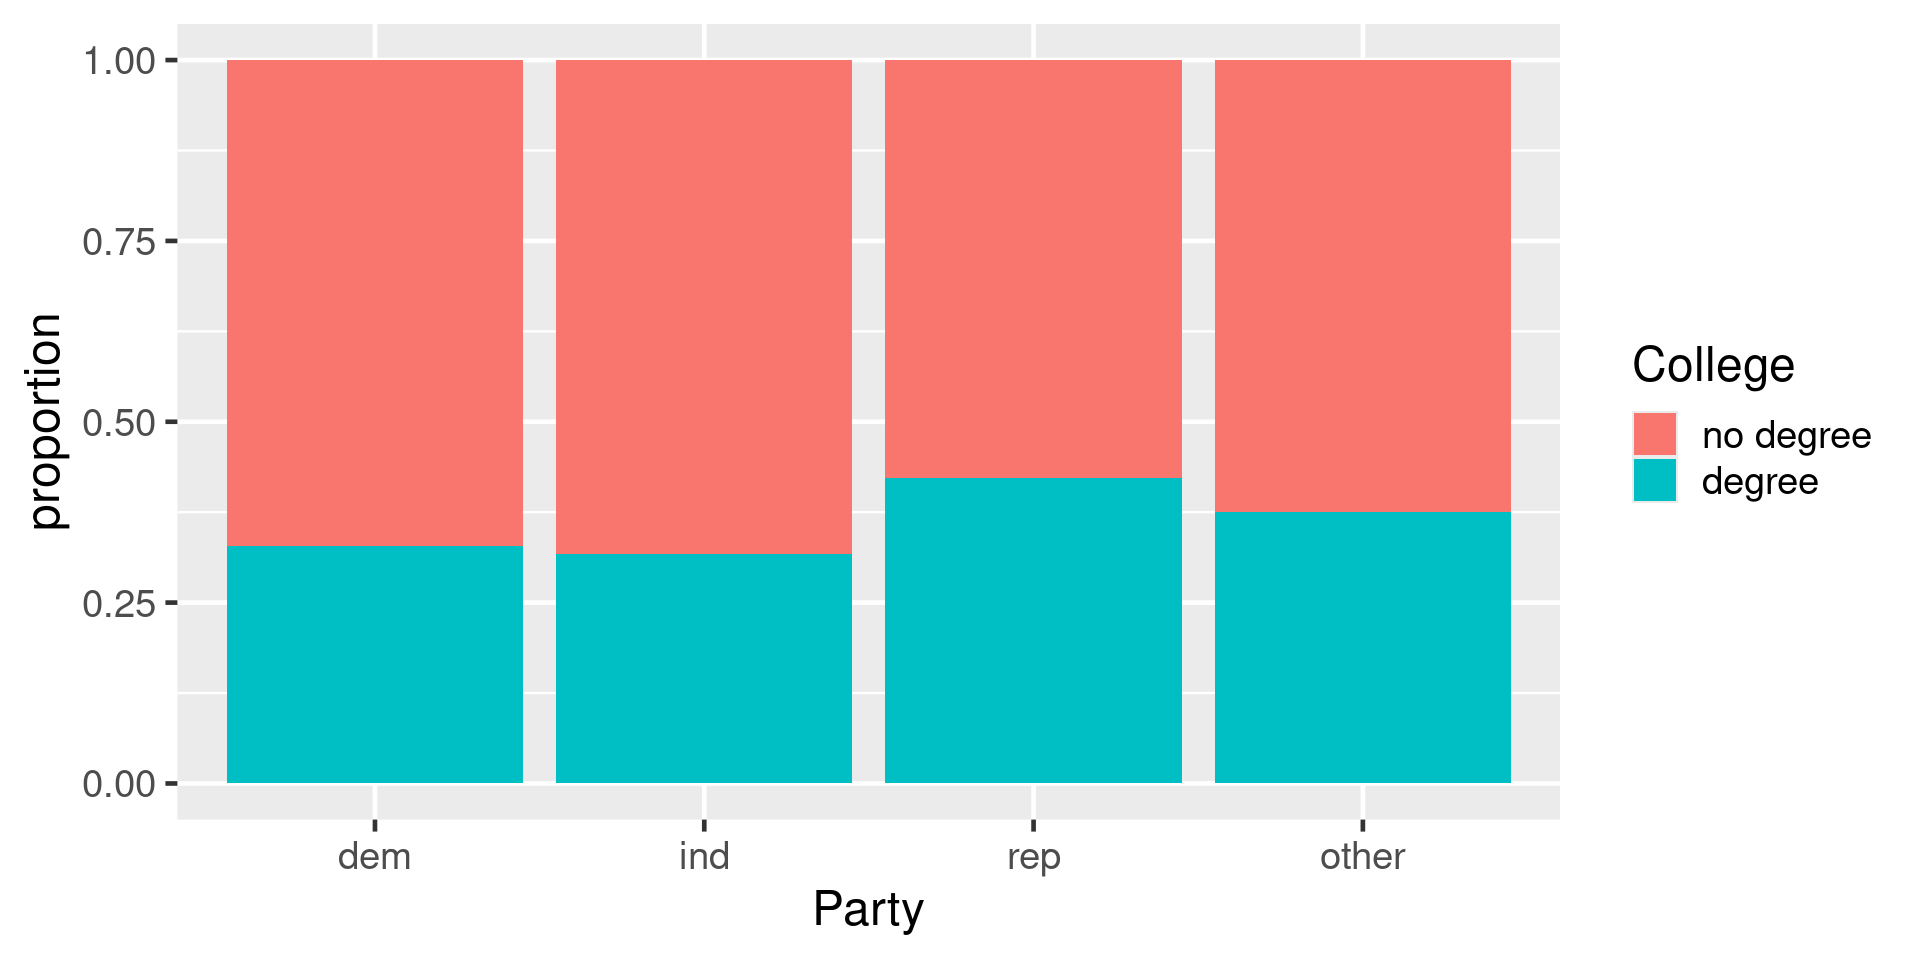
Which group is the largest?
01:00