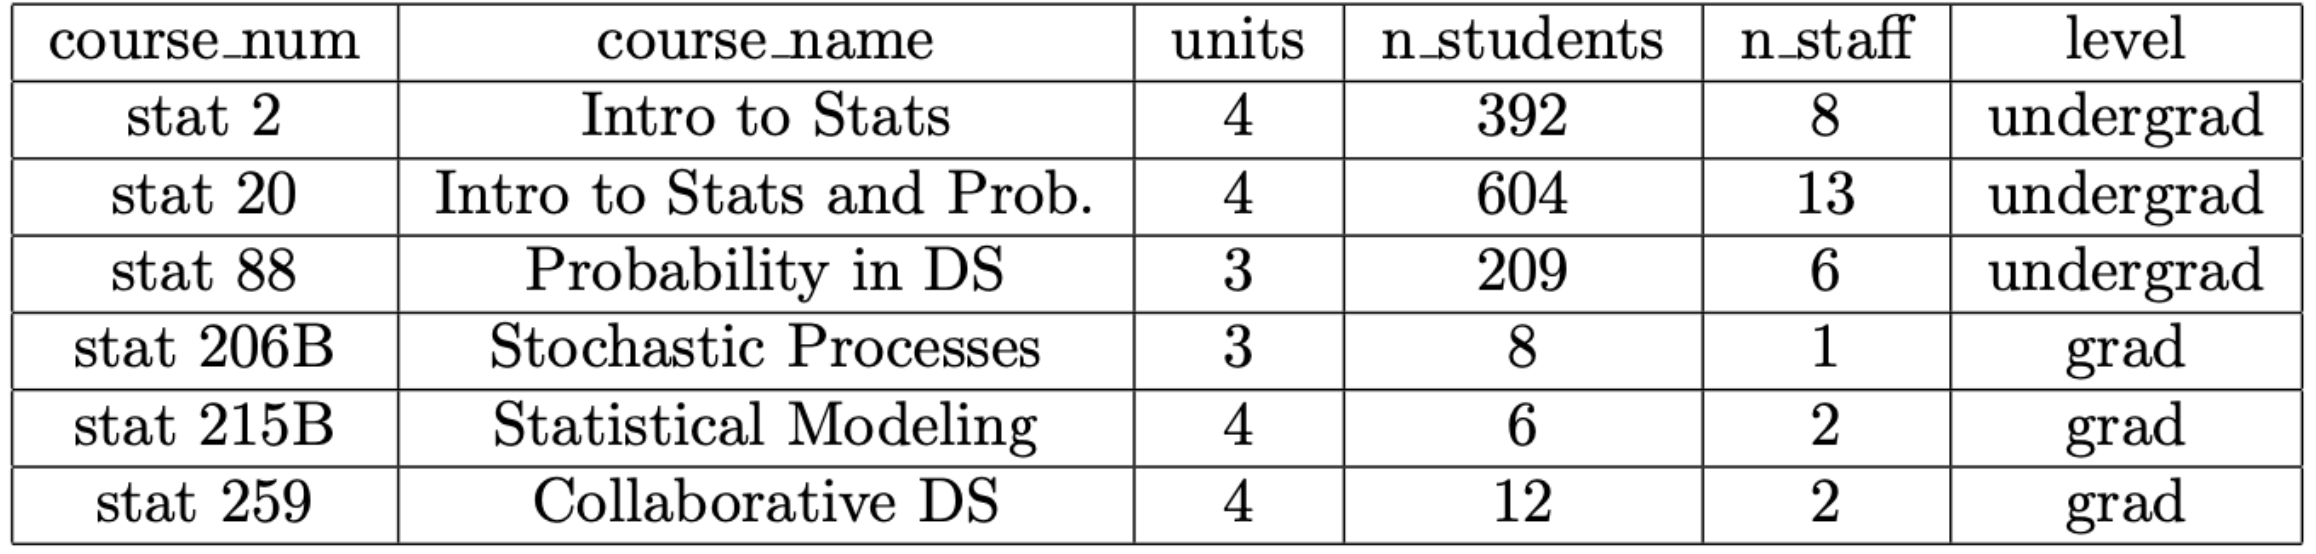
Taxonomy of Data
Not counting the course_num, how many variables are being recorded here?
- A. 3
- B. 4
- C. 5
- D. 6
- E. 7
00:30
What type of variable is the number of students?
- A. categorical, ordinal
- B. categorical, nominal
- C. numerical, discrete
- D. numerical, continuous
00:30
What is the most specific term that can be given to this data structure?
- A. spreadsheet
- B. table
- C. contingency table
- D. data frame
00:30
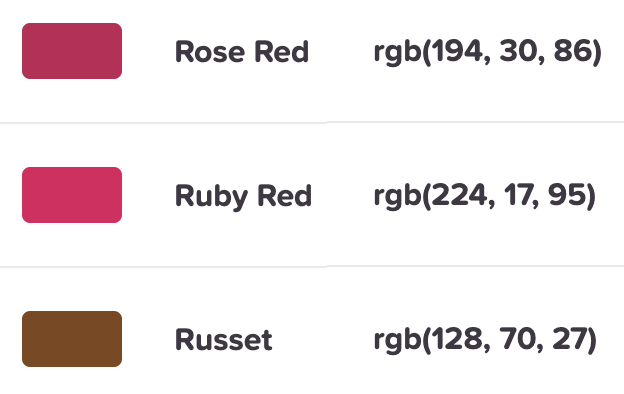
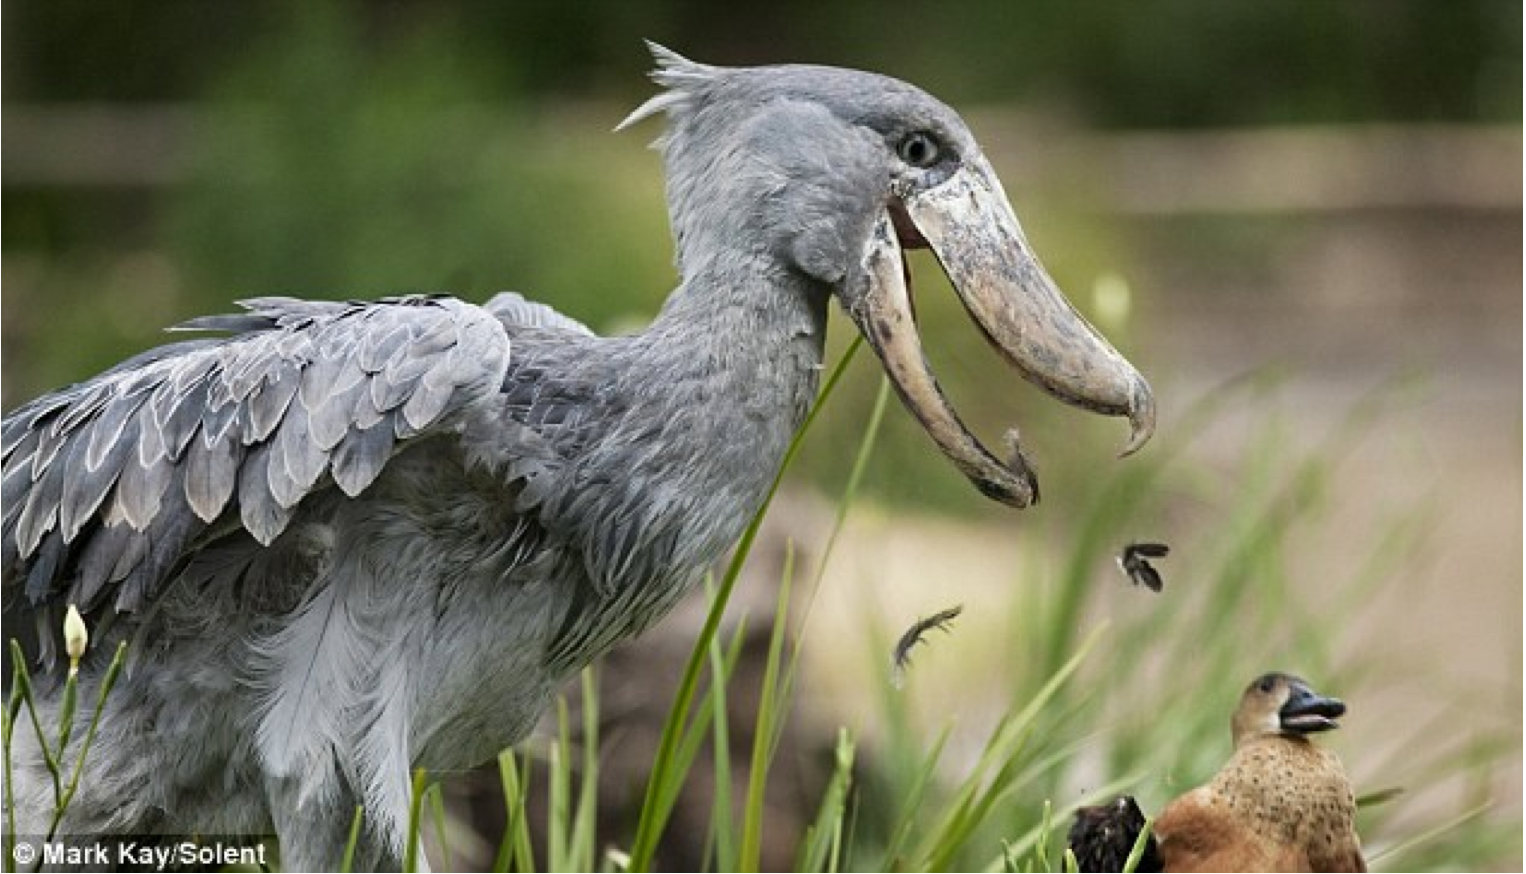
Images as data
Images are composed of pixels (this image is 1520 by 1012)
The color in each pixel is in RGB
![]()
Each band takes a value from 0-255
This image is data with 1520 x 1012 x 3 values.

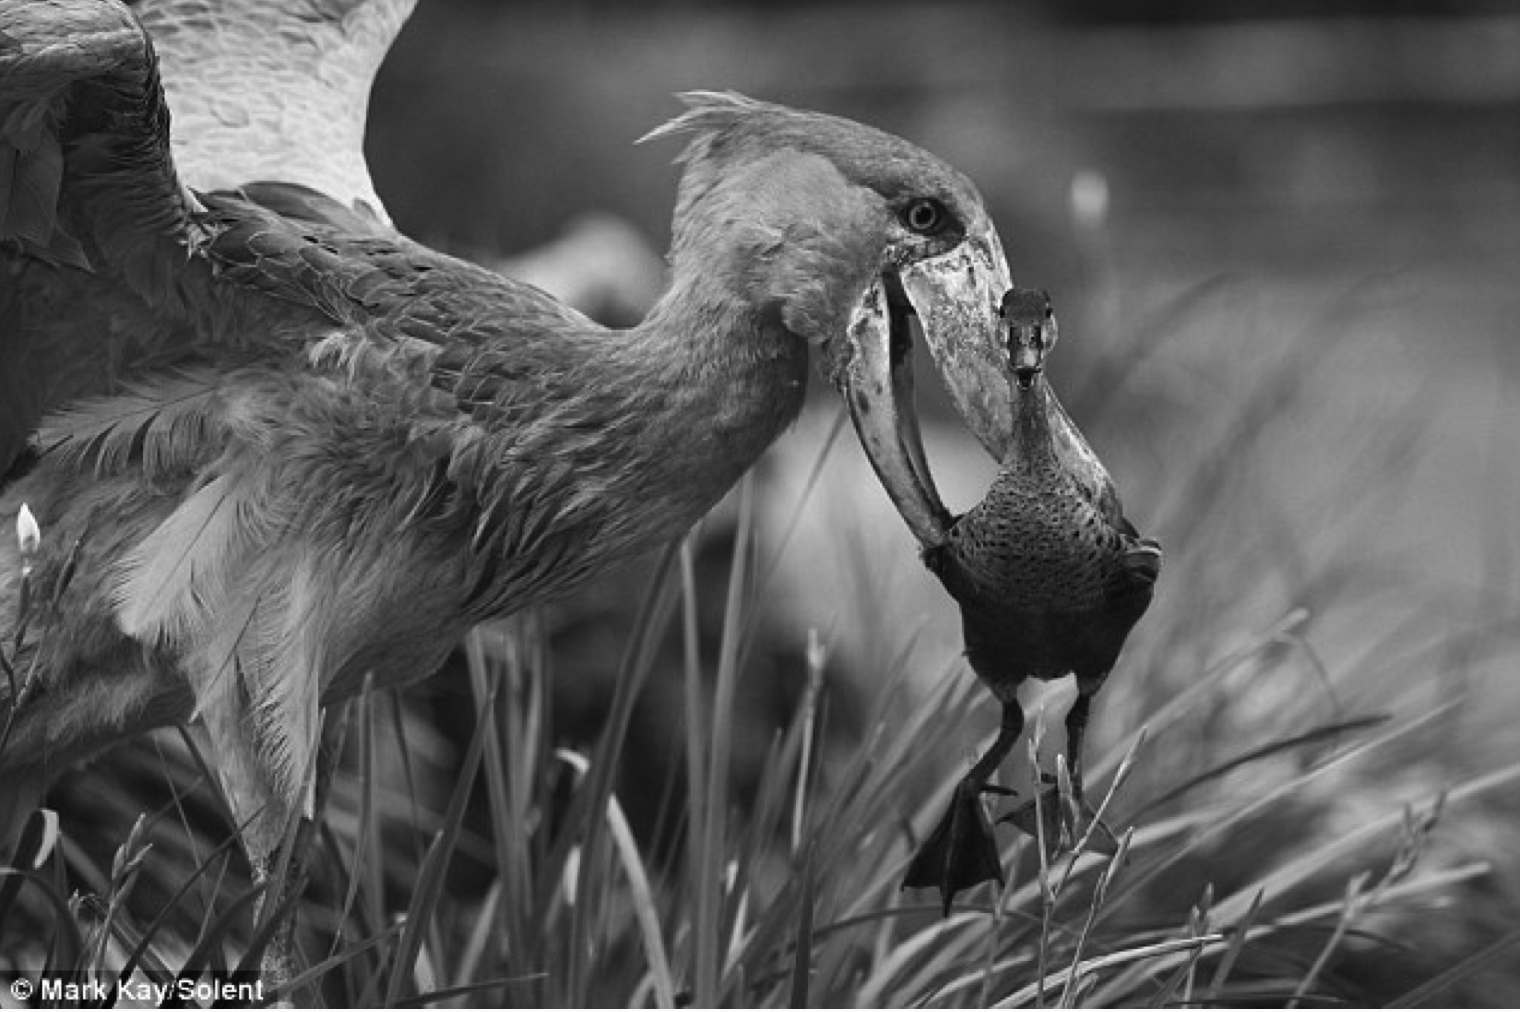
Grayscale
- Grayscale images have only one band
- 0 is black, 255 is white
- This image is data with 1520 x 1012 x 1 values.
Grayscale
- To simplify, assume our photos are 8 x 8 grayscale images.

Images in a Data Frame
Consider the following images which are our data:
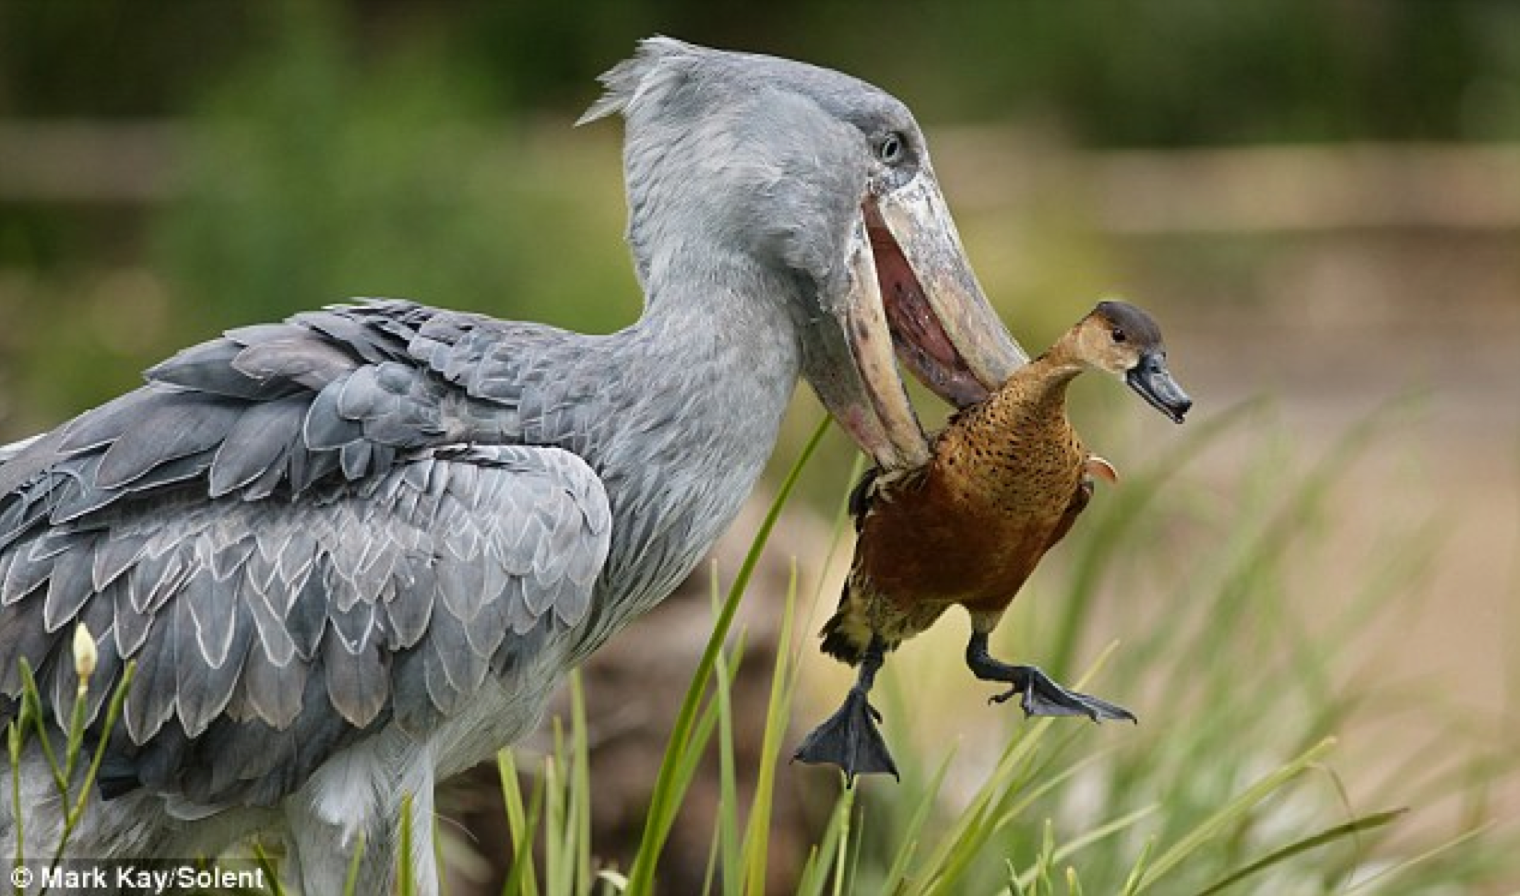
- Let’s simplify them to 8 x 8 grayscale images
Images in a Data Frame


If you were to put the data from these (8 x 8 grayscale) images into a data frame, what would the dimensions of that data frame be in rows x columns?